
Market Commentary— An Uncertain Landscape
The stock market continued its impressive run in the third quarter—albeit with a small hiccup in early August. The S&P 500 closed 5.5% higher, which brought the year-to-date gain through September to nearly 21%. Through the first nine months, the S&P 500 enjoyed its best start to a year since 1997.
However, the tone the market set over the past few months was much different than what had become the norm for this bull market. Throughout the past few quarters, Tandem’s various commentary pieces have spilled a good bit of ink in discussing the Magnificent Seven (Alphabet, Amazon, Apple, Meta, Microsoft, Nvidia and Tesla) as well as the AI rally. Those two pockets of the market were dominating and leaving everything else in the dust. Well, the third quarter, despite the solid gain, marked a decidedly more conservative mood in the market as traditionally defensive pockets like the Utilities, Consumer Staples, and Health Care sectors all outpaced the market.
It’s interesting to note that despite the 40+ record highs for the S&P 500 in the first nine months of 2024, debate has arisen as to whether a divergence between the economy and the market has appeared. The labor market, while still strong, has weakened a bit. The unemployment rate bottomed in April 2023 at 3.4%. By the end of July 2024, it had risen to 4.3%. Subsequently, there was a burst of volatility in early August as the market fell 6% in the first three trading days of the month. Market pundits, as they are wanting to do, tried to find plenty of things to blame for the quick sell-off. Some blamed the unwinding of a complex trade called the Yen Carry Trade. Others cited the poor economic data as causing recessionary fears. At Tandem, we tend to believe that selloffs happen when the pendulum swings too far in one direction. What causes the pendulum to ultimately swing back is often irrelevant in our mind.
Sir Isaac Newton once said, “What goes up must come down” and I think that quote applies to markets in this case. The Nasdaq 100 Index, which is made up of the 100 largest non-financial companies listed on the Nasdaq stock exchange and consists of names like Apple, Microsoft, Amazon, Meta, Nvidia and Tesla, has been on an absolute tear since October of 2022. From October 14th, 2022, through July 10th of this year, the Nasdaq gained more than 90%—its best period since late 2021 and early 2022, which ultimately preceded a 35% pullback in the tech-laden index throughout the course of 2022.
The Nasdaq had an amazing run that was led by innovating AI companies and mega-growth companies alike. However, it seems that optimism may have gotten a little ahead of itself. As a result, the Nasdaq 100 Index fell a little more than 13% from mid-July into early August. So, blame the economy, or blame the Yen carry trade if you must, but we simply believe that nothing can go up in a straight line forever and that the occasional breather is warranted during a bull market.
Perhaps less debatable is the effect that the Federal Reserve is having on the marketplace. In September, the Federal Reserve cut interest rates by 50 basis points. That may not seem like a lot, but in recent history, there have been just a few 50 basis point cuts. The most recent one occurred in March of 2020 when the Federal Reserve reduced interest rates by 50 basis points during an emergency meeting on March 3rd. The Fed then reduced by a further 100 basis points just a few weeks later in an additional emergency meeting. Prior to that, one must go back to the Financial Crisis to find a 50 basis point cut. And, prior to that it was during the bursting of the Tech Bubble in the early aughts. Historically, 50 basis point cuts have occurred around recessions. So, are we or aren’t we entering one?
Though the Fed’s action may be historically indicative of a recession, its recent rhetoric has not been. According to Fed Chair Jerome Powell, the economy is “in a good place”. Despite the aggressive rate cut, it does not seem that the Federal Reserve thinks a recession is imminent. There are, however, a few economic indicators that have suggested a recession could be on the horizon—namely the Sahm Rule and the inversion of the yield curve. According to the Federal Reserve Bank of St. Louis, “The Sahm Rule identifies signals related to the start of a recession when the three-month moving average of the national unemployment rate rises by 0.50 percentage points or more relative to its low during the previous 12 months.” Since 1960, this indicator has never missed a recession. It is signaling one now. An inverted yield curve occurs when short-term rates are higher than long-term rates. Usually, debt with longer maturities will pay higher interest rates than shorter-term debt. Historically, an inversion of the yield curve has been indicative of a recession. Since the mid-70s, this indicator is also batting 1.000 when it comes to predicting recessions and it too has recently indicated an impending recession.
Perhaps this time is different. Perhaps these indicators will be wrong this time around. That is certainly possible and not an absurd idea. The economy does seem to be slowing. Consumers are still feeling the effects of inflation. But things are not presently awful. Conditions could deteriorate further, or they could improve. However, for a year that has seen 40+ record highs in the stock market, there is a lot of uncertainty.
There is economic uncertainty as to whether we are headed for a recession. There is geopolitical uncertainty as the wars in both Ukraine and Israel have seemingly no end in sight. There is uncertainty in the stock market as traditionally defensive sectors have become favored over the last few months. Last, and certainly not least, is the political uncertainty that always occurs during an election year.
Though it may not be obvious given I’ve spent the last thousand words or so discussing the current macro backdrop, my opinion, or anyone else’s at Tandem, does not have any bearing on how we manage money. We follow a mathematical discipline that seeks to identify specific companies we believe can help us attempt to deliver a more consistent, more repeatable, and less volatile investment experience. We are not invested “in the market”. We do not own “the market”. We construct a portfolio of select businesses that have historically grown through different economic cycles—both good times and bad.
Sometimes it is difficult to make sense of the big picture. Emotions, especially when it comes to an election year, can often impair judgement. To us, all of the headlines are just simply white noise that ought to be tuned out. As our founder and CEO said in the July 2023 edition of The Tandem Report, “We like to say that it is easier to have conviction about a company than an economy.” AI or the election cycle is certainly topical, but neither will move the needle in determining how much peanut butter and jelly J.M. Smucker (a Tandem holding) will sell. Whether AI is the future or a complete bust, whether former President Donald Trump is elected or Vice President Kamala Harris, Republic Services (another Tandem holding) will continue to pick up trash. As uncertainty rules the day, don’t let it rule your investment portfolio as well.
Commentary— Death, Taxes, and Market Volatility
In 1789, Benjamin Franklin penned in a letter that “… in this world nothing can be said to be certain, except death and taxes”. Mr. Franklin should have added market volatility to his list of certainties.
Since the turn of the century, the S&P 500 (which I will refer to as the market from here on out as it is one of the most widely followed measures of U.S. stock market performance) fell 50+% from March 2000 to October 2002; the market fell 57.7% from October 2007 to March 2009; 17% in 2010; 21.5% in the middle of 2011; 15+% throughout 2015 and into early 2016; nearly 12% in the first quarter of 2018, followed by another 20+% in the fourth quarter; a 35% decline in a few short weeks during the first quarter of 2020; and the market most recently fell 27.5% in 2022. In other words, markets fall. They also rise! In fact, they have historically risen way more often than they fell. And, as of this writing at least, there has never been a bear market that has not eventually been followed by record highs.
Looking in the rearview, it might seem an odd choice for Commentary’s topic this quarter to be volatility. After all, the market gained 1.13% in July, 2.28% in August, and an additional 2.02% in September. At a quick glance, there was hardly any volatility at all. However, the monthly returns fail to paint the whole picture.
As we discussed in Market Commentary, the tech-laden Nasdaq 100 Index, which is comprised of the 100 largest non-financial companies listed on the Nasdaq stock exchange and is made up of familiar names like Apple, Microsoft, Nvidia, Amazon, Meta (formerly Facebook), Tesla, and Alphabet (formerly Google), generally represents more technology, or growth, oriented companies. Coming into the 3rd quarter, the Nasdaq 100 had outshined the S&P 500, its broader based peer, for much of the past two years. Yet, from July 10th through August 5th, the tech-heavy index fell nearly 15%. This sudden burst of volatility caused market prognosticators far and wide to renew the debate as to whether or not we were heading for a recession and a bear market. The rapid drawdown in what had been the winning index year-to-date also led some to reconsider their investment exposures, which, in short, is why Commentary is discussing volatility this quarter.
We believe market declines, and the inherent volatility within them, to be public enemy #1 for most investors. Plenty of studies have been done over the years highlighting how individual investors will often chase performance. John Bogle (the father of passive investing and founder of Vanguard) once did a study in 2009 that looked at individual investors’ returns relative to the funds that they owned. The individual investor typically underperformed the funds they were invested in by 4.5% per annum. This massive self-inflicted underperformance was the result of poor timing in and out of the funds by the individual investor. In other words, investors routinely chase performance higher when the market is high and they then sell following periods of poor performance. Don’t believe me? Look at when dollars come into and out of markets. The stock market had inflows in 1999 and 2000 (prior to the aforementioned 50+% drop) and outflows in 2002 (after the drop) and 2009 (after the decline during the Financial Crisis). Again, we ascribe this irrational and counterproductive behavior to volatility.
So, what is volatility? Well, let’s start with the basics. Investopedia defines volatility as the statistical measure of the dispersion of returns for a given security or market index. Simply put, volatility measures the size of the price swings in the asset. A CD at your local bank would have virtually no volatility—it simply is what it is. On the other hand, cryptocurrencies would have enormous volatility because they have massive upward and downward swings. Technically, volatility refers to both up and down moves in the market. However, most market commentators are discussing downward swings when they reference volatility. I don’t think many of us would complain that our investments are going up too fast (which would cause upward volatility). Instead we are most concerned when our investments go down too fast (which would cause downward volatility).
It’s our opinion that trying to limit volatility in the assets one invests in is a key component to a successful investment experience. Take the three hypothetical portfolios below. Which would you choose to own?
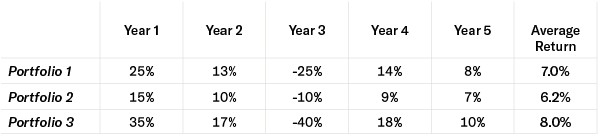
These are not real investments. This is created for illustrative purposes only.
At a quick glance, I would imagine many investors would choose Portfolio 3—the average return is highest after all. Perhaps some would choose Portfolio 1 because the drawdown during the third year isn’t quite as dramatic as Portfolio 3’s decline. Portfolio 2, though, the apparent loser, has the lowest average return. It’s the least interesting on the surface. Right? Not necessarily! If your goal is to make money over that hypothetical five-year time frame, then Portfolio 2 would actually be your best bet of those three hypotheticals.
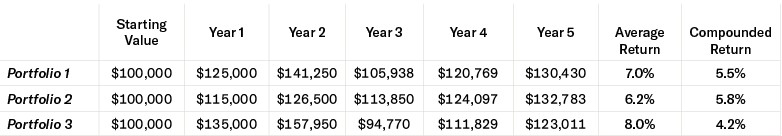
These are not real investments. This is created for illustrative purposes only.
Why? Because Portfolio 2 avoided volatility and avoided large declines. It was steady eddy. By producing a more consistent investment experience, Portfolio 2 reduced the overall volatility of returns and, in our opinion, kept investors on a more likely path to success.
We think it’s not about making more. It’s about losing less. When investments turn south, as they inevitably do from time to time, the more one loses, the more one must make back to get back to even.
The strategy of losing less does not mean be conservative. It does not even have to mean you will make less. It simply means that managing risk as well as your return might lead to a better experience.
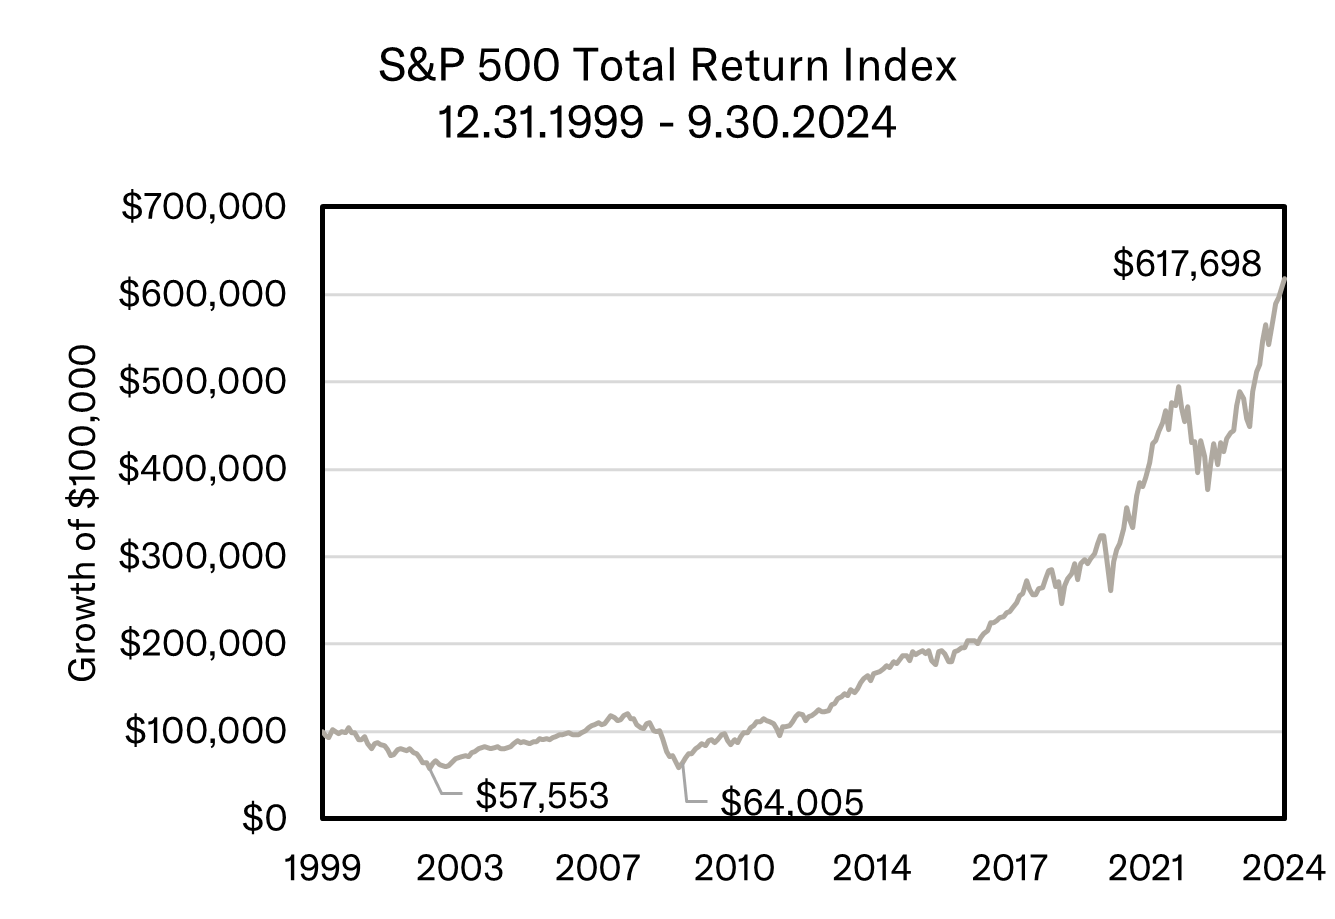
These are not real investments. This is created for illustrative purposes only.
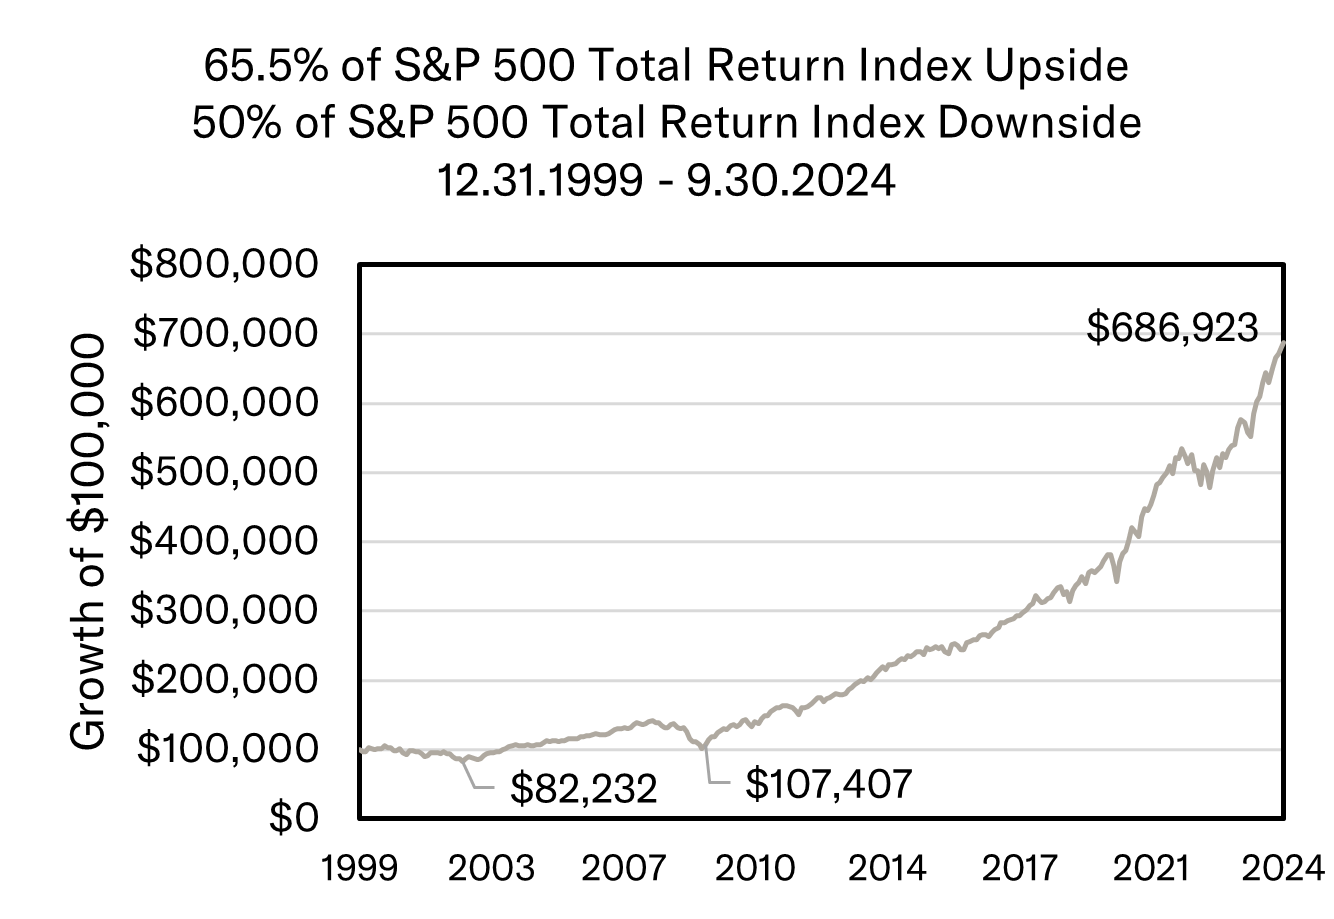
These are not real investments. This is created for illustrative purposes only.
The benefit of minimizing volatility is two-fold in our minds though. The first benefit of lowering volatility is illustrated in the above hypothetical scenarios. By avoiding volatility and by minimizing drawdowns, one can have higher annualized returns despite lower average returns. However, the second and perhaps less obvious benefit relates back to Mr. Bogle’s findings. Investors chase performance to the upside and then want out when the tide turns against them. In other words, when downside volatility gets too great, investors generally experience loss aversion and have shown a knack for selling low.
Loss aversion as a psychological and economic concept was first coined by famed psychologists Daniel Kahneman and Amos Tversky in 1979. Their findings conclude that losses were twice as powerful, psychologically speaking, as gains. Losses can cause us to behave differently and to even act emotionally. I cannot think of another industry where sales are perceived to be a bad thing and rising prices are considered so good that we want more. Each November, lines and lines of people queue in front of Walmarts and Best Buys across the country to take advantage of Black Friday sales. The idea of buying holiday presents at a steep discount is enough that Black Friday shopping has become something of a tradition in this country. Yet when stocks go on sale, lots of normally rational people want nothing to do with them. Loses are painful. Periods like March of 2020, where the stock market was down 35% in less than a month’s time, or throughout 2022, when the market was down 27% in a few quarters, were periods where stocks were on sale. Stocks were also on sale in late 2008 and early 2009, but equities saw outflows instead of inflows. Yet inflows reach fever pitch when the stock market hits high after high. Like retail shoppers, wouldn’t investors be better served by buying something on sale?
Volatility is a double-edged sword because there is both upward and downward volatility. Yet for the past 21 months, we have really only seen just one side of that sword—markets have largely risen with very little downside volatility. Since the end of 2022, the S&P 500 is up more than 50%. The Nasdaq 100 Index has risen more than 80%. Be forewarned, expecting volatility to remain on just one side of the ledger is likely foolhardy. For as long as there have been markets, they have gone both up and down. They tend to go up more than down, but as we’ve hopefully illustrated here, caution is warranted when it comes to losses.
Too often investors discuss the notion of in versus out. That’s nonsensical to us. We believe that you should be in, not out. But even better than that, you ought to let prudent management of risk dictate how in you are.
At Tandem we strive to deliver a more consistent, more repeatable, and less volatile investment experience. In our efforts to do that, we also take seriously the notion that we ought to buy low and sell high. When there are more things to sell than there are to buy, our quantitative model and our process is signaling that risk is rising. As risk rises and as we sell, cash levels in our portfolios will rise. That is how we effectively manage exposure to how “in” one ought to be. Admittedly, this will occasionally be frustrating to some. We are quite content with taking a little risk off the table and selling at prices our process tells us are unsustainably high. That allows us to have the cash on hand to put money back to work at prices our process tells us are reasonably attractive.
Death, taxes, and the return of market volatility. Whenever volatility does return, we will be ready to view that as an opportunity to put money to work.
Share:
Disclaimer: Tandem Investment Advisors, Inc. is an SEC registered investment advisor.
This audio/writing is for informational purposes only and shall not constitute or be considered financial, tax or investment advice, or an offer to sell, or a solicitation of an offer to buy any product, service, or security. Tandem Investment Advisors, Inc. does not represent that the securities, products, or services discussed in this writing are suitable for any particular investor. Indices are unmanaged and not available for direct investment. Please consult your financial advisor before making any investment decisions. Past performance is no guarantee of future results. All past portfolio purchases and sales are available upon request.
All performance figures, data points, charts and graphs contained in this report are derived from publicly available sources believed to be reliable. Tandem makes no representation as to the accuracy of these numbers, nor should they be construed as any representation of past or future performance.
Insightful Updates
Delivered
Timely and engaging information—right to your inbox.
More Commentary
The Tandem Report
With 2024 now in the books, it was certainly another good year for the S&P 500. The index gained more than 20% for the second consecutive year and the third time in the past four years.
Notes from the Trading Desk
U.S. stocks have stumbled out of the gate to start 2025, with the S&P 500 and Nasdaq both registering back-to-back weekly losses in the first two weeks of the year. The S&P 500 declined 1.94% last week, its fourth weekly decline in...
Observations
December painted a mixed picture across U.S. financial markets with varied performance among major indices. The S&P 500 declined by 2.50%, while the small-cap Russell 2000 suffered a sharp 8.40% loss and nearly gave back all of November’s huge gains.