- Market Commentary — I’ll Stop the World and Melt (up) with You
- Commentary — The Market Climbs a Wall of Worry. Or is it Stimulus?
- Revisiting the Amount of Cash in Your Portfolio
Market Commentary— I’ll Stop the World and Melt (up) with You
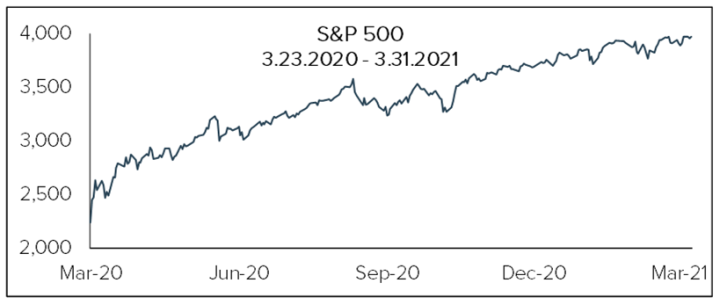
The stock market continues its impressive run. Beginning in March 2009, with what we will call a bear correction (a new term we are coining), through the first month of the COVID pandemic, the S&P 500 is on a twelve-year tear. Bad news is good news, good news is good news, and even no news is good news. The S&P is up 77.57% from its COVID low closing March 23rd of last year through March 31st of this year. That is an impressive run within an impressive run.
In fact, the market has all the makings of a melt-up. New record levels for the Dow and S&P are being set pretty regularly. The Dow was up 7.76% for Q1, while the S&P advanced 5.77%. A new stimulus package totaling $1.9 Trillion, more stimulus checks in the mail, fewer cases of COVID, and more vaccinations all provide reason for great optimism, and stock prices are the clear beneficiary. Prepare for lift-off.

To further accommodate market sentiment, the Federal Reserve has committed to keeping rates low even if the rate of inflation becomes uncomfortable. They assure us that any inflation that manifests itself in the coming months is merely transitory and not sustainable. The ingredients for a melt-up are present.
The Federal Reserve balance sheet now exceeds 35% of GDP. To most readers this means little. For perspective, it was 3% during WWI, 11% for WWII, and 15% for the Financial Crisis, according to FactSet Research. So, this is big. And with no plans to scale this back, again, conditions for a melt-up are favorable.
Positive corporate earnings growth is also arriving just in time. In January, S&P earnings were expected to decline roughly 9% for Q4 2020. They actually posted +4% growth. Positive earnings growth of 4% is certainly welcome news. Is that why we are set for a melt-up? Not likely. It feels more like justification than reason. 4% growth is hardly noteworthy, given that the investing public has clearly expected an economic recovery sooner rather than later. It is here, but it was also the reason prices rose last year. So why do they keep rising?
Stimulus checks and excess liquidity in the financial system are leading to some interesting occurrences. Stocks like GameStop have seen wild speculative swings based on certain online community influences. A challenging regulatory environment has somewhat curtailed the number of companies coming public via traditional means. This has resulted in the proliferation of a vehicle known as a SPAC (Special Purpose Acquisition Company). SPACs come to market without the same regulatory scrutiny of a new issue and can raise billions of dollars to purchase private companies. And they raise this money without anyone knowing which companies they may buy. Yes, the conditions are present for a melt-up.
Prices rose during the pandemic in the expectation of a turnaround. The turnaround is here. All the news is good. Yet the government stimulus spigot remains wide open, and investors are loving it. This market is too good to not be in. But you don’t need to be ALL in. Discretion is the better part of valor. To paraphrase Gordon Gecko, greed is good, in moderation.
Commentary— The Market Climbs a Wall of Worry. Or is it Stimulus?
There is an old Wall Street adage that says that markets climb a wall of worry. There should be a new one that says markets climb a wall of stimulus.
Talk about throwing gasoline on a fire! The Federal Reserve has created about $3.5 Trillion, and Congress has passed nearly $6 Trillion in the stimulus. That’s $9.5 Trillion. That is a lot of zeroes! Eleven of them, to be precise: $9,500,000,000,000. That is nearly half of this Nation’s annual GDP put into circulation. With the economy rebounding and vaccinations growing, we were already poised for a handsome recovery. This is going to be a recovery on steroids!
During the recession/bear market that followed the bursting of the Tech Bubble and then 9/11, there was minimal stimulus provided by either Fiscal (Congress) or Monetary (Federal Reserve) Policy tools. The recovery was slow, and from the market’s monthly closing bottom in September of 2002 to it’s then all-time monthly closing high in October 2007, the S&P 500 gained 90%
Following the Great Recession brought on by the Financial Crisis, fiscal stimulus arrived in then unprecedented fashion in the form of what was known as TARP (Troubled Asset Relief Program). The amount was roughly $800 Billion, coming in the waning days of the Bush Administration. The American Recovery and Reinvestment Act, passed in the first days of the Obama Administration, added another $800 Billion or so, but that was spread over a period of 10 years. The monetary response was equally unprecedented, as the Fed created an additional $3.6 Trillion through Quantitative Easing. That’s a total of about $5.2 Trillion, spread over 10 years, in response to the greatest financial crisis since the Depression. The recovery was again slow, but ultimately quite rewarding. From the market’s monthly closing bottom in February 2009 to it’s then all-time monthly closing high in January 2020, the S&P 500 gained 192%.
Apparently, a pandemic requires more stimulus than does a once-in-a-generation financial crisis or an attack on our Nation. And it requires it faster as well. Not only has the COVID stimulus more than doubled that of the Financial Crisis, but it has occurred in roughly 1/10 the time. If stimulus continues for much longer, there might not be enough zeroes to count that high. No wonder the economy, the stock market, and even inflation, are running hot. This time, the recovery has been rapid, and quite rewarding. From the market’s monthly closing bottom in March 2020 to its so far all-time monthly closing high one year later in March 2021, the S&P 500 is up 54%.

Source: BofA Global Investment Strategy, EOFR Global. BofA Global Research
Unlike in 2009, the Fed acted quickly and decisively this time around. And Congress showed the will to act as well. But these bold, swift, and unprecedented actions come with unintended consequences. The intended consequences are noble – help those in need and support the economy through the pandemic. The unintended consequences, should they materialize, could create nearly as much hardship in the long run as there was benefit created in the short run. But why worry about future consequences? The present sure looks terrific.

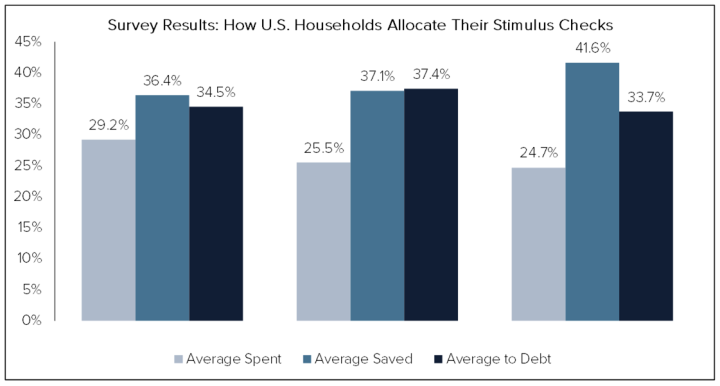
Source: From CNBC.com: Federal Reserve Bank of New York. Round 1 based on 1,423 respondents to the June 2020 special SCE survey who reported receiving a stimulus check. Round 2 and 3 results are based on 1,062 and 1,007 respondents to the January and March 2021 Core SCE Surveys, respectively, who received or expected to receive second– and third-round stimulus checks.
When the Fed acts, they do not have the ability to put money directly into the hands of the people most affected. They pump money into the financial system, creating a wealth effect as asset prices rise. This has resulted in the inflation of financial asset values, benefitting disproportionately those fortunate enough to own financial assets. This widens the wealth gap.
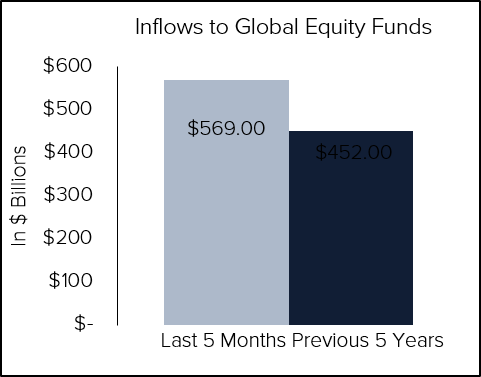
When Congress acts, they do have the ability to put money directly into the hands of people. But Congress lacks the ability to act with precision, so a lot of people that don’t need assistance get it anyway. For those in need, the stimulus provides a lifeline. For the rest, the stimulus could give inflation a boost we haven’t seen since the 1970s. It also seems to be funding a lot of Robinhood accounts. If you doubt this, here is a fun fact illustrated by the accompanying table. According to BofA Global Research, more money has flowed into global equity markets in the last 5 months than did in the previous 12 years. Wow. Where could all of that money come from?

A lot of money has been pumped into financial markets, and a lot more money has been put into the hands of the public. As a result, the economy is strong, GDP will approach China’s levels of growth, and the stock market is reflecting all of this strength. But the stock market is also benefitting from simple Supply vs. Demand.
We are often asked why the market goes up on a given day. A reasoned response is that there were more buyers than sellers. While the answer may seem flippant, it is also undeniably true. The basic economic principle of Supply vs. Demand states that when demand outstrips supply, price will rise. Conversely, when supply exceeds demand, price will fall. More buyers than sellers mean more demand than supply, and so price rises. It really can be as simple as that.
Evidence, both empirical and anecdotal, suggests that stimulus checks have increased demand. If you doubt that, just glance at the table above that reports how U.S. households are allocating their stimulus checks. So far, there have been three rounds of stimulus. Surveys after each asked what recipients did with the money. The most common answers were spend it, save it and pay down debt. Of these three categories, spending is last, by a fair amount. Saving and paying down debt are the clear winners.
Isn’t that great news for the American taxpayer? We paid for trillions of “relief” that went to savings and debt reduction. As the table above illustrates, the per capita amount of this stimulus is 4 times greater than the 2008 stimulus and twice as much as the cost of The New Deal. One year after the crisis relative to its peak, the market was down 30% post–2008 and 37% post-New Deal. It was up 22% post-COVID. The size of fiscal response to this pandemic dwarfs anything we have ever seen before. Given the amount of money flowing into markets the last 5 months, no doubt a good portion of this money found its way into stocks. In other words, demand increased because the government gave some people money they didn’t need.
Stock markets rally for many reasons. Some of them are signs of long-term economic health. Others are indicative of some short-term event. To which do you think the current market rally traces its origins?
To shift gears a bit, some will argue that underlying fundamentals are so strong that price increases are more than justified. Only a fool would argue that fundamentals are anything less than robust. However, are these strong fundamentals sustainable? Differing opinions make a market. If we all agreed all the time, there would only be buyers or sellers, not both. Present circumstances have created more buyers than sellers. Unless the government plans to make its largess permanent, it is hard to see how this spike in demand is sustainable. Yes the future looks bright in the short run, but what happens when stimulus dries up? Will an Infrastructure bill replace direct payments to households as fuel for the fire? Yes, if passed it would. But then what? What comes after that?
Stock prices are rising to reflect the immediate boom, but they also rose throughout the pandemic in anticipation of this same boom. Are we not now pricing this boom twice? What happens next?
Government doesn’t produce anything. All their money comes from us. At some point, fundamentals need to improve on their own. Government help is great through tough times, but not permanently.
Revisiting the Amount of Cash in Your Portfolio
Tandem has been managing money for more than 30 years. Over that time, we have a pretty good record of having a decent amount of cash in portfolios at or near market tops. We also have a pretty fair record of putting that cash to work when valuations become more compelling. That is how buying low and selling high is supposed to work, and that is what we pledge to try to do.
We are far from infallible, but we do our best. Buying low and selling high takes a tremendous amount of discipline and a complete lack of emotion. Most investors have neither.
Oftentimes, our actions can cause some amount of anxiety among our clients. Going with the crowd is always easier to do in the moment. Investors seem to take comfort in numbers and prefer doing what everyone else does. FOMO (Fear Of Missing Out) constantly plays with the psyche of most investors in an up market. Just plain fear takes hold as markets decline. Yet we stay true to our discipline, through all markets.
During the depths of the market selloff in 2020, many were unnerved by our willingness to buy when most were selling. Yet buy we did, following our investment discipline and putting money to work at compelling valuations. In the moment, it scared some people. It also turned out to be the right thing to do. We weren’t smarter than anyone else. We just knew that our discipline, rooted in math, is a far better judge of company values than our opinions. When markets are setting record highs, it is not unusual for the math to suggest to us that some of our companies are unsustainably overvalued. We view this as a gift from the market not to be turned down. And so we sell a portion of what we own in any unsustainably overvalued company. Sometimes, there are more things to sell than buy, and so cash levels in the portfolio rise. Cash levels may even rise to the point that clients fear they are missing out on rising prices. And again, we trust the discipline that is rooted in math, not emotion.
We work hard to preserve our clients’ capital when we see fewer opportunities, so that the capital is there for us to deploy when better opportunities present themselves. If we just stayed fully invested at all times, we would never have the ability to take advantage of market selloffs. And so far, over our 30+ years, those selloffs have always come. We expect this time will be no different.
Some call us conservative. Some call us defensive. Some call us other things. All labels may be fair in the moment. But not always. We conserve when few opportunities present themselves and the math says sell.
We buy eagerly and aggressively when the opportunities return and the math says buy. We don’t time, and we don’t forecast. We follow the math. For 30+ years, it has been a good formula, and we don’t expect that to change.
Disclaimer: Tandem Investment Advisors, Inc. is an SEC registered investment advisor.
This audio/writing is for informational purposes only and shall not constitute or be considered financial, tax or investment advice, or an offer to sell, or a solicitation of an offer to buy any product, service, or security. Tandem Investment Advisors, Inc. does not represent that the securities, products, or services discussed in this writing are suitable for any particular investor. Indices are unmanaged and not available for direct investment. Please consult your financial advisor before making any investment decisions. Past performance is no guarantee of future results. All past portfolio purchases and sales are available upon request.
All performance figures, data points, charts and graphs contained in this report are derived from publicly available sources believed to be reliable. Tandem makes no representation as to the accuracy of these numbers, nor should they be construed as any representation of past or future performance.
Insightful Updates
Delivered
Timely and engaging information—right to your inbox.

More Commentary
Notes from the Trading Desk
A post-election surge in U.S. stocks drove major equity indices to all-time highs last week. The S&P 500 surpassed 6,000 and logged its 50th record high of the year, while the Dow Jones Industrials Average crossed 44,000 for the first time.
Observations
Major U.S. equity markets experienced some consolidation in October after several months of upward momentum. The S&P 500 broke a streak of five consecutive monthly gains, declining 0.99%.
The Tandem Report
The stock market continued its impressive run in the third quarter—albeit with a small hiccup in early August. The S&P 500 closed 5.5% higher, which brought the year-to-date gain through September to nearly 21%.